-
Imagine...
- having a complete picture of your Factory's energy consumption - unlocking the power to optimize efficiency.
- Knowing the precise energy consumption for well-produced and faulty products - making informed decisions for improvement.
- How much energy is consumed for a well-produced product? What about a faulty one?
- What if you could have a direct insight into what you could improve in your processes and stop wasting?
- Imagine being able to automatically calculate potential savings before investing - make confident decisions and maximize your return on investment.
- Easily pinpointing the changes that will truly make a difference, saving you time, money, and the need for constant engineering assistance.?
That is holding all the cards in your hands and keeping a watchful eye on what truly matters in your Factory - seize control and drive success!

-
Your Journey to Efficiency & sustainability starts with Data collection...
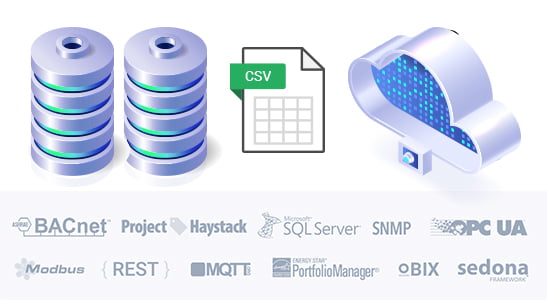
Every building is a data-rich environment. From smart meters to advanced sensors, buildings generate a wealth of data that can be used to improve efficiency, productivity, and sustainability. However, this data is often siloed and difficult to access. This can make it difficult for building owners and operators to make informed decisions about how to use this data to improve their operations. Our solution provides a single platform for collecting, storing, and analyzing building data. This allows building owners and operators to gain insights into how their buildings are performing and identify opportunities for improvement.
Our solution is also easy to use and can be customized to meet the specific needs of any building. If you are looking for a way to improve the efficiency, productivity, and sustainability of your building, then our solution is the perfect choice for you. Here are some specific examples of how our solution has helped building owners and operators improve their operations:
- A large office building used our solution to identify and fix inefficiencies in its lighting system. This led to a 20% reduction in energy consumption.
- A hospital used our solution to track the performance of its medical equipment. This allowed them to identify and repair faulty equipment before it caused problems.
- A school district used our solution to track the energy usage of their schools. This allowed them to identify and implement energy-saving measures that saved them $100,000 per year.
These are just a few examples of how our solution can help building owners and operators improve their operations. If you are interested in learning more about how our solution can help you, then please contact us today.
-
Making Sense of Your Energy Data
Once we have collected the available energy data, we will use our expertise to make sense of it so that you can understand it. We will label each piece of equipment, sensor, node, data, and location within a building in a standardized format, and create a method to understand the relationships between these elements. We are committed to respecting the Project Haystack Convention, which allows us to label the data in an unambiguous way. All data from components, software, and applications are organized and categorized. Once the labels are in place and the relationships understood, the data can become a valuable source of information.
We can use this data to:
- Identify trends and patterns in energy consumption
- Improve energy efficiency and reduce energy costs
- Identify energy waste and optimize energy usage
- Develop and implement energy management strategies
- Meet sustainability goals
Insight from this meaningful information this data can also help to create new products and services and to develop new business models.
The possibilities are endless. By making sense of your energy data, we can help you to achieve your energy goals and to improve your business.

-
Monitoring and Data Analysis: Unleashing Actionable Insights
Once your data has been imbued with profound meaning, transforming it into a fount of invaluable information, we unlock its true potential by embarking on a journey of automated monitoring and in-depth analysis.
To accomplish this, we harness the power of SkySpark Analytics, a cutting-edge tool that automatically scrutinizes data emanating from smart devices and equipment systems. By leveraging this advanced technology, we pinpoint issues, faults, deviations, and anomalies that hamper system performance, enabling us to drive improvements, minimize downtime, and optimize operational resources. Our tailored solution, designed specifically for your unique requirements, delivers precise, quantifiable actions to enhance your operations.
For example, we can use data to predict when a piece of equipment is likely to fail. This allows us to take proactive steps to prevent failure, such as scheduling maintenance or replacing the part. This can save you time and money in the long run.
We can also use data to identify areas where you can improve your efficiency. For example, we can analyze your energy usage data to find ways to reduce your energy consumption. This can save you money and help you to be more environmentally friendly.
Our offerings extend far beyond the realm of mere reporting on live and historical data and events. We harness the power of data to forecast potential future issues, ensuring minimal downtime and maximizing overall efficiency.
Remember, just because something is functional does not necessarily mean it is efficient. There is always room for improvement. Hence, our automatic and continuous monitoring, coupled with comprehensive analytics, serves as your steadfast 24/7 engineer, tirelessly striving to propel your operations to new heights.
We are here to help you make the most of your data. Contact us today to learn more about how we can help you improve your operations.
-
Accessible Dashboard: Empowering Action through Clear Insights
In the pursuit of productivity and efficiency, rapid access to and comprehension of valuable information is paramount. The way in which information is presented directly influences the effectiveness of subsequent actions. In addition to our robust monitoring and analysis capabilities, we consolidate the outcomes of the initial three steps into an intuitive, user-friendly dashboard. Furthermore, we provide comprehensive reporting delivered directly to your email, tailored to your preferred schedule.
These meticulously crafted dashboards serve as a gateway, offering administrators and maintenance personnel unprecedented insight into the most pertinent information about the operational aspects of your building systems. With the power to access these dashboards from any location and through any smart device, you possess the freedom to make informed decisions and take immediate action based on real-time, easily comprehensible data.
Here are some of the ways our dashboards can help you:
- Improve efficiency: Our dashboards can help you identify areas where you can improve your efficiency by providing insights into your building systems' performance.
- Prevent failures: Our dashboards can help you identify potential problems before they cause failures, saving you time and money.
- Make better decisions: Our dashboards can help you make better decisions about your building systems by providing you with the information you need to make informed choices.
If you're looking for a way to improve the productivity and efficiency of your building systems, our accessible dashboards are the perfect solution. Contact us today to learn more about how we can help you.

Congnitive Analytics


-
Smart and Efficient Factory
Our solution as a service can monitor, analyze, and optimize your factory installations. It can also send data back to the installations so that settings can be automatically adjusted to your desired values. This makes your factory a smart building, where operational efficiency and productivity are maximized.
Efficiency improvement in a matter of weeks with real-time data analytics
Our Cloud bases Analytics service automatically analyzes electrical systems, energy & equipment data, to identify issues, faults, deviations and correlations, all of which are opportunities for improved performance and operational savings. With customised accessible dashboards and reporting tools that provide administrators and maintenance team with lightning-fast insight for even faster action. See below what our dashboards and tools can do for you:
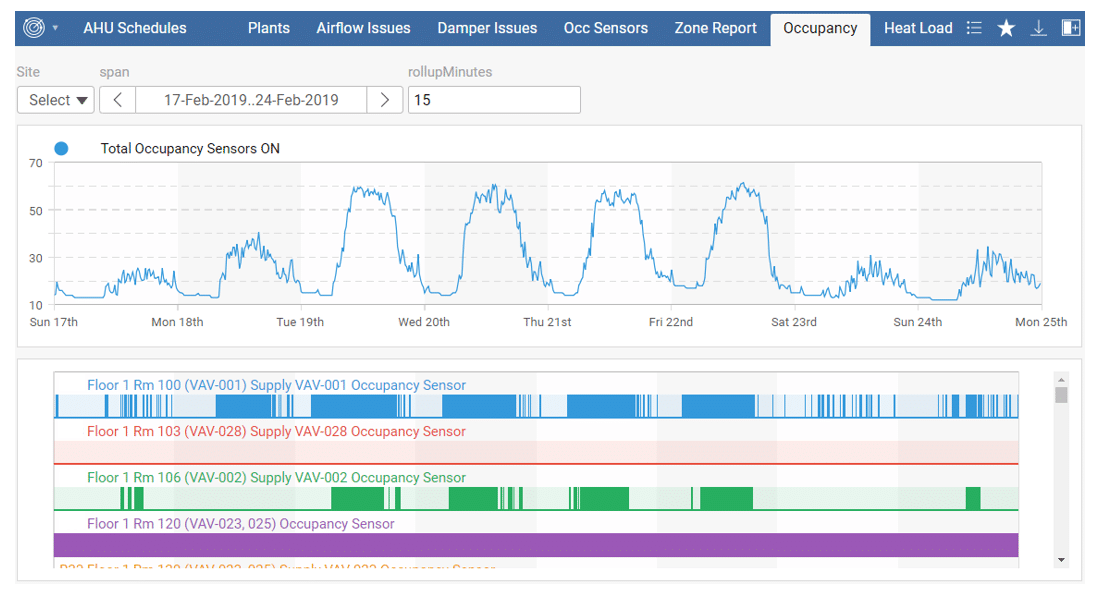
Quick scan
Insight into the operation of your entire building installation by means of graphs at a glance. By linking different data points, the user gets a combined overview of all factors that influence the operation of the installation.
Maintenance
Our cloud-based analytics service can help maintenance workers in factories improve their performance, save money, and make better decisions by providing real-time insights into operations, identifying patterns of equipment failures, and tracking the performance of different machines. We have a proven track record of success in helping factories improve their operations.
Energy
Our cloud-based analytics service provides insights into energy consumption compared to previous periods and comparable objects. The dashboard can be customized to normalize data based on floor area, degree days, and CO2 emissions. We also offer the ability to link to smart meters and monitor generated energy.
Our service is used by businesses of all sizes to improve their energy efficiency and reduce their carbon footprint. We have a team of experts who are available to help you get the most out of our service.
Comfort
We continuously monitor a variety of factors to determine the comfort level of our available rooms. This includes temperature, carbon dioxide levels, the oscillation of heating valves, and the turbulence of air flows.
With SkySpark, we give meaning to your Data
Nodematics services are based on SkySpark software, the world's most advanced IoT analytics platform that automatically analyses data from automation systems, meters, sensors, and other smart devices to identify issues, patterns, deviations, faults and opportunities for operational improvements. With SkySpark, we collects, stores, organizes, analyses, and visualize vast amount of IoT data across multiple systems. Due to the simple display and the clear analyses, SkySpark can be used by building managers, facility managers and other involved parties, and more importantly: SkySpark is an independent software and you will always remain the owner of your data. So you are never tied to Nodematics.